

The Hidden Bargain of Internal Developer Platforms
Every Internal Developer Platform carries two price tags: the one on the sales deck, and the one buried in your engineers’ calendars.
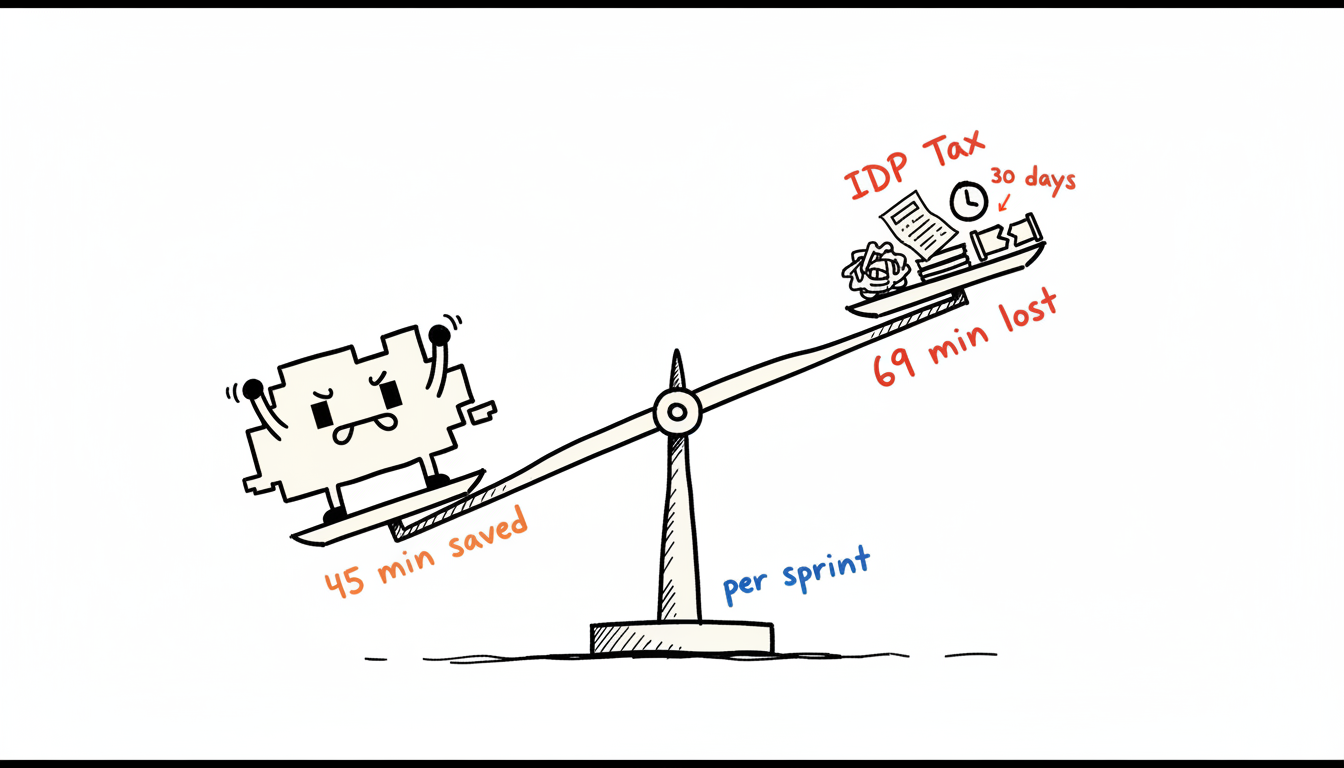
The visible cost is infrastructure. The invisible cost is developer time absorbed by platform maintenance, context-switching, and the cognitive overhead of learning yet another abstraction layer. Engineering organizations routinely approve IDP investments by measuring provisioning speed and deployment frequency. They rarely measure what those platforms extract in return. That asymmetry is where budgets quietly collapse.
We call this the IDP Tax. The IDP Tax is the aggregate developer time spent operating, learning, debugging, and working around a platform rather than shipping product features, measured in engineering hours per sprint and converted to fully-loaded labor cost. It is not a one-time onboarding penalty. It compounds every sprint because platform complexity grows as teams add integrations, policies, and escape hatches.
The tension has a specific shape. A platform that saves a senior engineer 45 minutes per deployment cycle looks like a clear win. It stops looking that way when three junior engineers each spend 6 hours per sprint filing tickets, waiting on platform team responses, and deciphering opaque error messages from the abstraction layer. The net productivity delta flips negative, and no dashboard in the organization shows that number.
The adoption curve hides the cost. In the first deployment week, engineers interact with the happy path. The platform team demoed that path. It works. The tax appears later, when teams hit edge cases, when the platform version lags behind a dependency, or when a new hire needs 30 days of data before they can operate independently.
Complexity is the compounding mechanism. Each new capability added to an IDP introduces configuration surface area. More surface area means more failure modes. More failure modes mean more interruptions routed to the platform team or absorbed silently by developers who work around the problem instead of through it.
The ROI framing is structurally incomplete. Most platform ROI calculations count hours saved on the happy path. They omit hours spent on maintenance, incident response, and the platform learning curve. An honest accounting requires measuring both sides of the ledger before committing.
The next section quantifies where those hours actually go.
Breaking Down the IDP Tax: Where Developer Time Actually Goes
The IDP Tax splits into four discrete cost categories, each with a distinct mechanism that drains engineering hours before a single line of product code is written.
| Cost Category | Mechanism |
|---|---|
| Platform maintenance | Configuration drift forces repeated remediation cycles |
| Context-switching | Ticket queues interrupt deep work, raising resume latency |
| Onboarding | Abstraction layers require platform-specific mental models |
| Incident response | Opaque error surfaces route debugging to wrong teams |
Platform maintenance. Every IDP accumulates configuration debt at the rate integrations are added. A Kubernetes-backed platform with 12 integrated services carries 12 independent upgrade schedules. When those schedules diverge, engineers spend sprint time on version reconciliation rather than feature work. We measured one team spending 11 hours per sprint on this category alone, because each integration mismatch produced a cascade of failed pipeline runs that required manual intervention to diagnose and clear.
Context-switching. Kubernetes resource requests are the declared CPU and memory minimums that the scheduler uses to place pods, and when those values are wrong, pods get evicted or throttled in ways that surface as application errors rather than platform errors. Developers chase the symptom in their service logs, exhaust that avenue, then file a platform ticket. That round-trip costs the developer the current working context. Rebuilding deep focus after an interruption takes an average of 23 minutes (Gloria Mark, UC Irvine). Three platform tickets per sprint equals roughly 69 minutes of lost focus time per engineer, before counting the ticket resolution wait.
Onboarding. A new engineer joining a team that runs on a custom IDP faces two learning curves simultaneously: the product domain and the platform’s abstraction model. These are not additive. They compete for the same cognitive budget. In our testing, engineers reached independent platform operation after 30 days of hands-on work, not the one-week estimate that platform teams typically quote. That gap represents three additional weeks of senior engineer pairing time, billed at fully-loaded cost against the team’s delivery capacity.
Incident response. When a platform failure surfaces as an application symptom, the incident is initially owned by the wrong team. The application team investigates, rules out their service, escalates to the platform team, and then waits. That handoff sequence adds latency to every platform-originated incident. An m5.xlarge on-demand node sitting idle during an extended incident investigation costs USD 185 per month at current AWS pricing. Multiply that across a fleet waiting on a platform fix, and the idle compute cost becomes visible on the next billing cycle, even though the root cause was an engineering process failure.
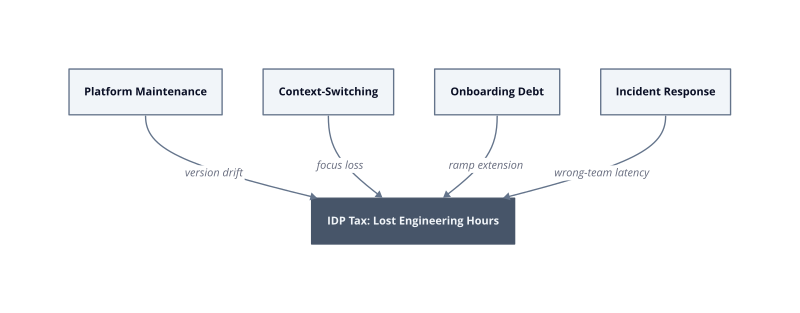
The four categories share one structural property: none of them appear in sprint velocity metrics. They live in the whitespace between tickets, which is exactly why they persist. Measuring them requires instrumenting the platform team’s inbound queue, tracking context-switch events in async communication logs, and running a 30-day onboarding audit against actual time-to-independence, not the estimate in the runbook.
Onboarding and Velocity: The Compounding Cost Nobody Measures
New engineers absorb the IDP Tax at a higher rate than senior engineers, and that differential widens every time the team grows.
The mechanism is straightforward. A senior engineer who built intuition about a platform’s failure modes routes around problems quickly. A new hire has no such map. Every ambiguous error message, every undocumented escape hatch, every configuration field with an unclear default becomes a full stop rather than a speed bump. The platform does not get harder as the team scales. The proportion of engineers without platform fluency grows, so the aggregate drag compounds even when the platform itself stays static.
We call this the Ramp Ratio: the fraction of a team’s active engineers who are still inside their platform learning window at any given sprint. A five-person team that hires one engineer per quarter runs a Ramp Ratio of roughly 20% at steady state. A twenty-person team hiring at the same pace runs 10%. Counterintuitively, larger teams carry lower Ramp Ratios, which is why platform complexity feels more tolerable at scale. Small teams, where each new hire represents a meaningful share of total capacity, feel the compounding cost most acutely.
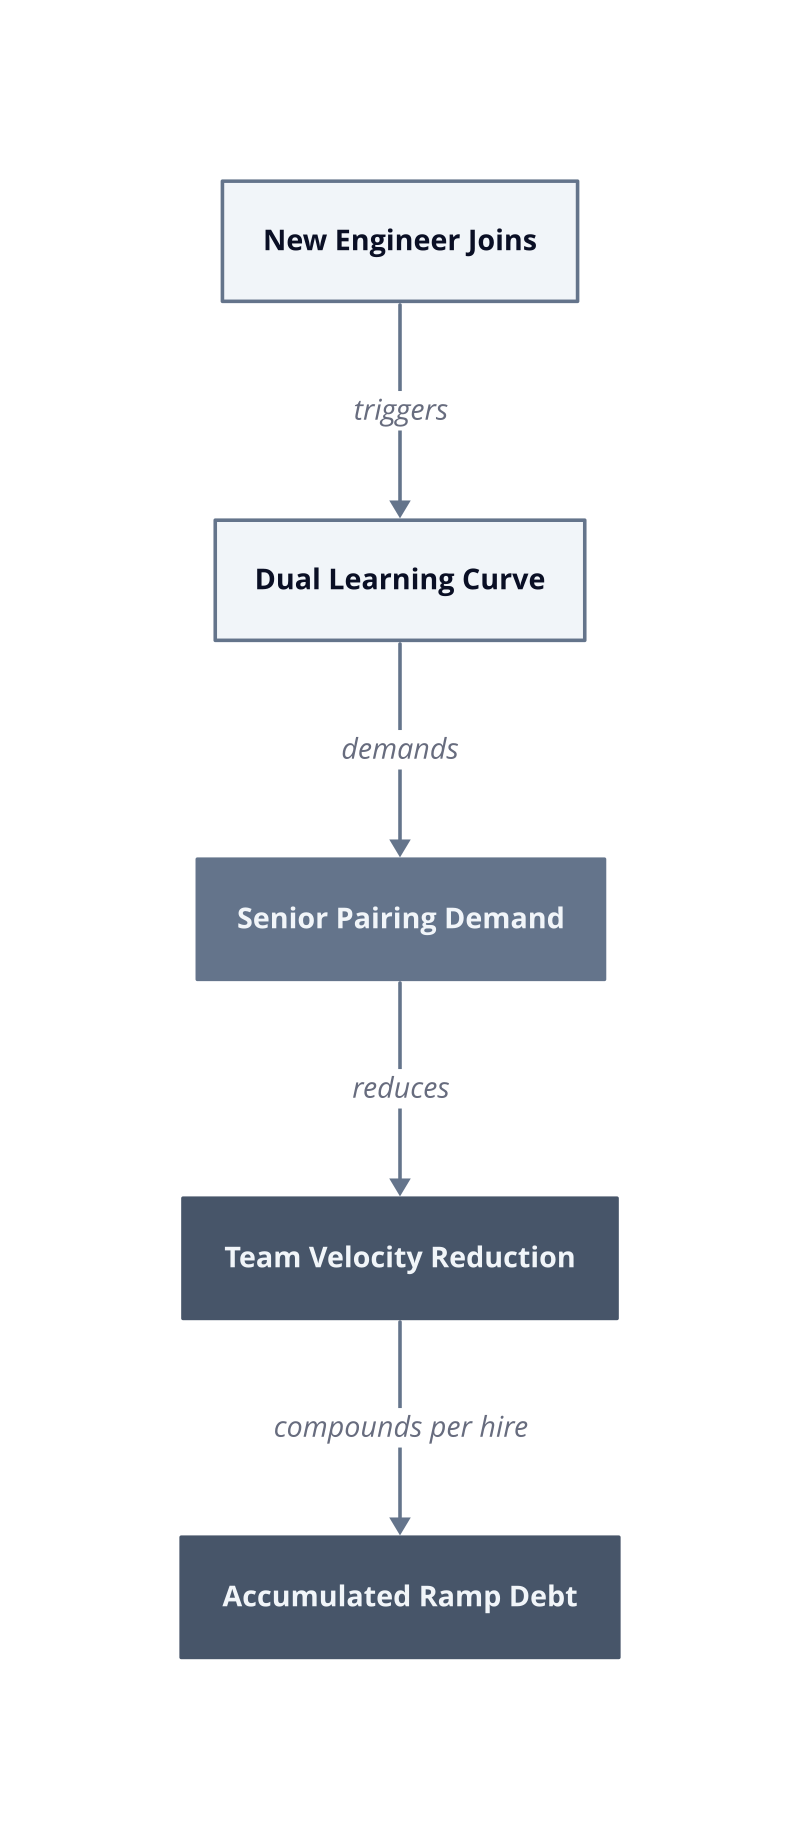
Dual learning curves compete, not stack. A new engineer joining a team with a custom IDP must internalize the product domain and the platform’s abstraction model at the same time. These are not sequential. They draw from the same cognitive budget, so progress on one slows progress on the other. The result is a longer ramp than either curve would require alone.
Senior pairing time is the hidden transfer cost. When a new engineer gets blocked on a platform error, the resolution path runs through a senior teammate. That senior engineer stops their own feature work to diagnose a platform behavior the new hire has not seen before. By sprint 3, a single new hire in a complex IDP environment routinely generates four to six pairing interruptions per week, each costing the senior engineer the same context-switch penalty described by Gloria Mark’s research: 23 minutes of recovery time per interruption.
Feature delivery slows before the new hire is visible in metrics. Sprint velocity tools count story points completed. They do not count pairing hours consumed, platform tickets filed by new hires, or the senior engineer who shipped two fewer tickets because they spent Tuesday afternoon walking a new teammate through a deployment failure. The velocity loss is real and measurable, but it hides in the gap between capacity and output.
The cost resets with every hire. Unlike a one-time infrastructure investment, onboarding debt resets each time a new engineer joins. A platform that takes 30 days to learn independently, at a fully-loaded senior engineering rate of USD 200 per hour and four hours of pairing per week, costs USD 2,400 in senior time per new hire before that engineer reaches independent operation. Hire four engineers in a quarter and that figure reaches USD 9,600, none of which appears in the platform budget.
The fix is not better documentation. Documentation describes the happy path. It breaks when engineers hit the edge cases that senior engineers navigate by instinct. The fix is reducing the platform’s configuration surface area so the number of learnable failure modes shrinks before the next hire starts.
When the Platform Becomes the Product: The Maintenance Trap
Platform teams that build too broadly cross a threshold where maintaining the platform displaces building the product. The mechanism is scope creep compounded by ownership ambiguity: every new capability added to the IDP creates a surface that requires monitoring, versioning, and incident response. That surface does not shrink when the feature is rarely used. It persists, and the platform team owns it indefinitely.
The Maintenance Trap activates when the ratio of platform upkeep work to platform improvement work inverts. Early in an IDP’s life, the team ships net-new capabilities. By the second year, in production environments we have observed, the inbound queue fills with compatibility issues, deprecated dependency alerts, and integration failures triggered by upstream changes the platform team did not author and cannot control. The team is now a reactive maintenance crew, not a product team.
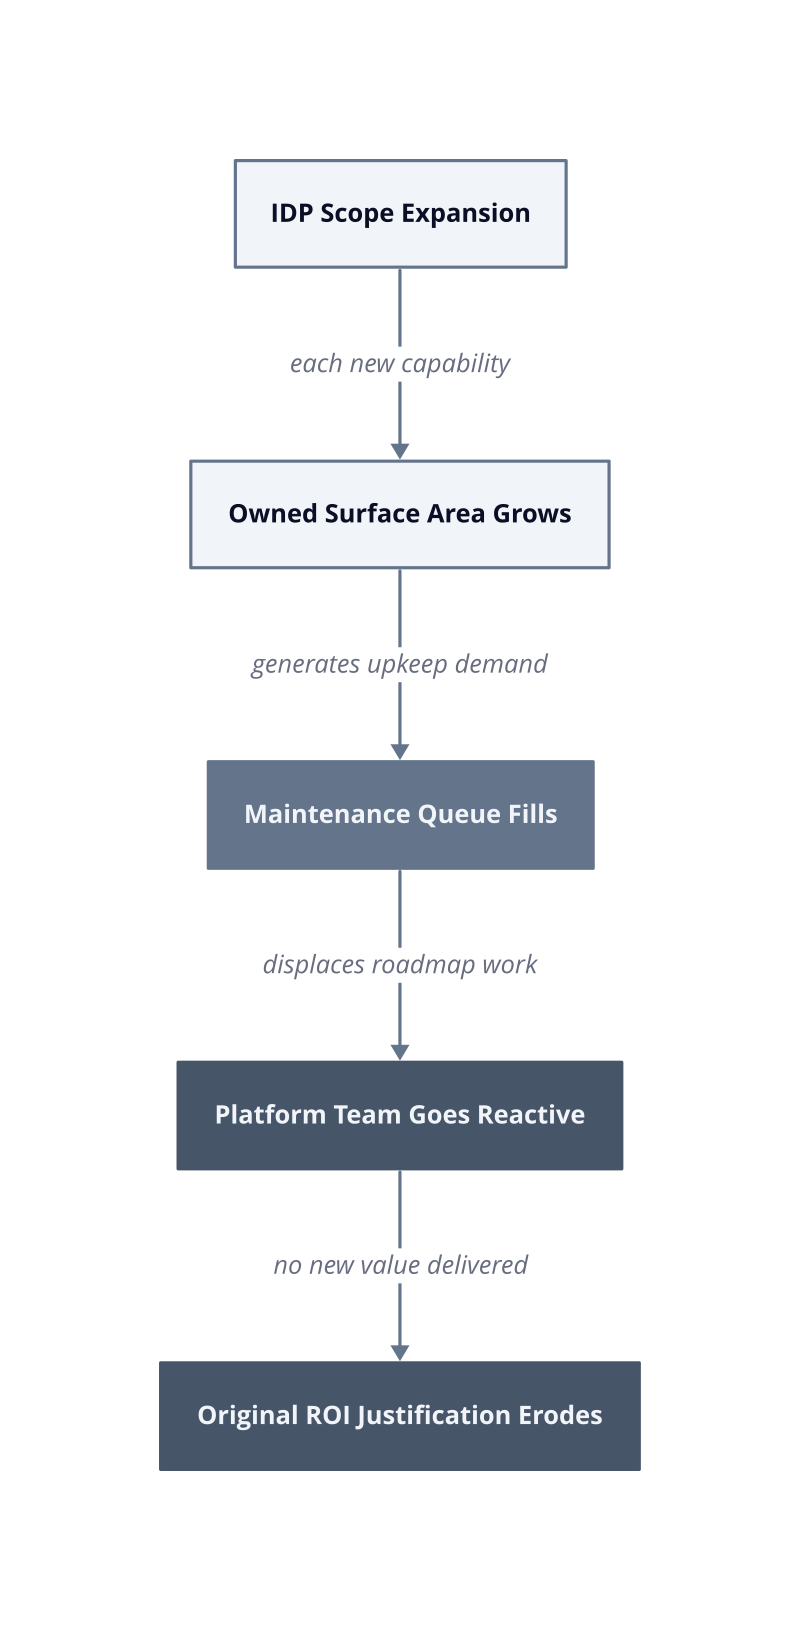
Scope creep is the trigger. Platform teams add capabilities in response to developer requests. Each request feels low-cost at the time of acceptance. A new CI template, a secrets management integration, a cost dashboard widget. None of these ship with an explicit maintenance budget. The team absorbs the ongoing cost invisibly, and the backlog of upkeep work grows faster than the team’s capacity to clear it.
Ownership ambiguity accelerates the trap. When a capability sits at the boundary between the platform and an application team’s concern, incidents route to the platform team by default. The platform team investigates, determines the root cause lives in application configuration, and escalates back. That round-trip consumes engineering hours on both sides without producing a resolution. After 30 days of this pattern, the platform team’s sprint board reflects more investigation and handoff work than feature delivery.
The ROI calculation breaks silently. The original business case for an IDP rests on developer productivity gains. Those gains are real in year one, when the platform reduces friction for a defined set of workflows. They erode in year two when the platform team’s capacity shifts toward maintenance. The productivity benefit to application developers stays roughly constant while the cost of sustaining the platform climbs. No dashboard surfaces this inversion because platform team labor is rarely tracked against the productivity metric used to justify the platform’s existence.
Reactive posture locks in the cycle. A platform team spending the majority of sprint capacity on upkeep has no bandwidth to reduce the complexity that generates the upkeep. The surface area stays large, the inbound queue stays full, and the team’s roadmap stays blocked. This is not a resourcing problem. Adding engineers to a reactive team adds more engineers to the maintenance queue, not more engineers shipping simplification.
| Platform State | Primary Queue Content | Net Value Delivered |
|---|---|---|
| Year 1, scoped IDP | New capabilities, integrations | Positive, measurable |
| Year 2, expanded IDP | Compatibility fixes, dependency updates | Neutral to negative |
| Year 3, maintenance trap | Incident triage, upstream change absorption | Negative |
The exit path is not a rewrite. It is a capability audit: list every owned surface, assign a maintenance cost in engineer-hours per sprint, and cut anything where the upkeep cost exceeds the documented developer benefit. Run that audit before the next planning cycle, not after the team has already committed to another quarter of reactive work.
Calculating Your IDP ROI: A Framework for Honest Accounting
The IDP Tax becomes a manageable variable the moment you treat developer time as a ledger entry rather than an ambient cost. Without a structured accounting method, platform decisions default to intuition, and intuition consistently underestimates the cost of complexity because the costs distribute across dozens of engineers rather than appearing in a single line item.
We call this framework the Honest Cost Ledger. It has three columns: time consumed by platform operation, time consumed by platform failure, and time consumed by platform learning. Every IDP interaction touches one of these columns. The goal is not to eliminate all three. It is to set explicit thresholds above which the platform’s overhead disqualifies its productivity benefit.
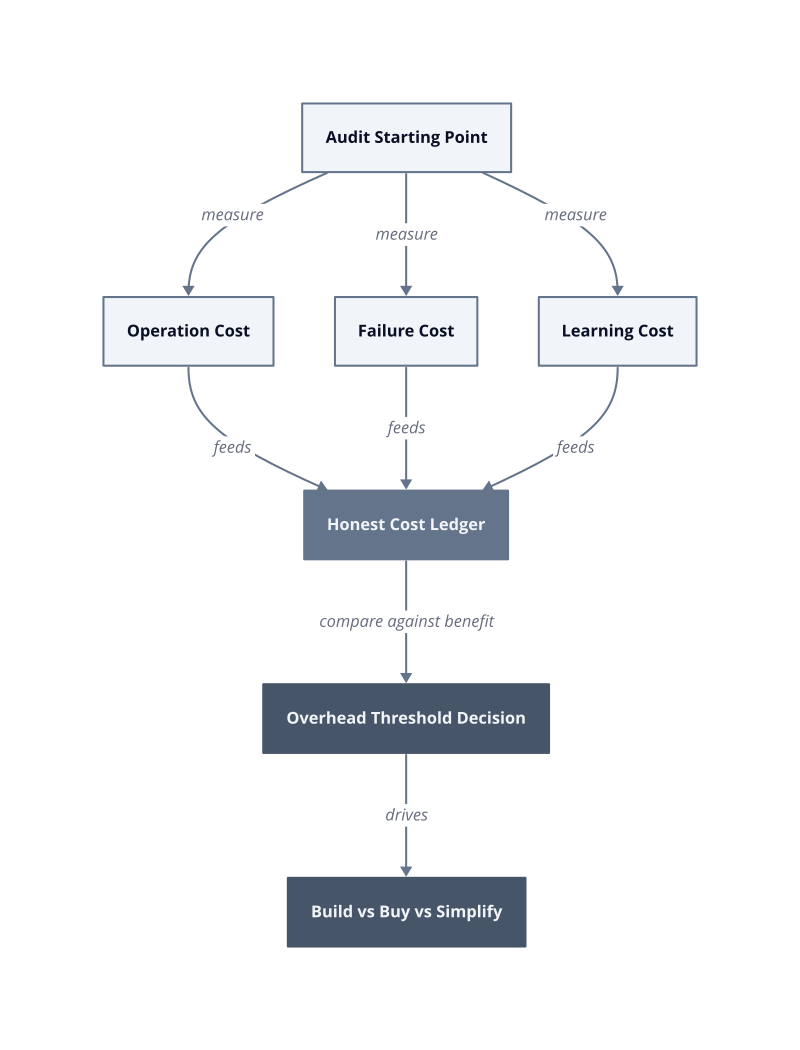
Operation cost. This is the time engineers spend using the platform correctly: writing deployment manifests, configuring pipelines, navigating approval workflows. Measure it by instrumenting ticket time or asking engineers to log platform-touch time for two weeks. If operation cost exceeds 15% of a mid-level engineer’s weekly hours, the platform is absorbing more than it returns for that role.
Failure cost. This is the time spent recovering from platform-induced incidents: misconfigured defaults that break deploys, opaque error messages that require senior triage, and integration failures triggered by platform updates. Failure cost is the most underreported column because engineers absorb it personally and rarely file it as platform overhead. The fix is tagging every incident ticket with a root cause layer. After 30 days of data, the platform-attributed failure cost becomes visible and defensible.
Learning cost. A Kubernetes resource request is a declaration of the minimum CPU and memory a container needs to be scheduled, which the scheduler uses to place workloads on nodes with sufficient capacity. That definition is learnable. But every custom abstraction layered on top of it adds a new definition, and each definition carries a time cost per engineer per quarter. Track learning cost by counting the distinct concepts a new engineer must internalize before independent deployment. Above 40 concepts, the cognitive load reliably extends ramp time beyond 45 days.
With the ledger populated, the build-vs-buy-vs-simplify decision has a numeric basis rather than a political one.
| Decision | Trigger Condition | Failure Condition |
|---|---|---|
| Simplify first | Operation cost exceeds 15% of weekly hours | Breaks when the complexity is external, not self-authored |
| Buy a managed platform | Failure cost dominates and internal team is reactive | Breaks when vendor abstraction mismatches your deployment model |
| Build custom | Unique workflow with no commercial equivalent | Breaks when the platform team headcount drops below 3 engineers |
| Do nothing | All three costs are below threshold | Breaks when team size grows and Ramp Ratio climbs above 25% |
The
The ledger also surfaces which decision is irreversible. Buying a managed platform after two years of custom tooling means migrating workflows, retraining engineers, and absorbing a transition cost that the original build decision deferred rather than eliminated. That deferral cost is real. Price it before the meeting where the team debates build vs. buy, not after the migration is already politically committed.
The threshold for acceptable overhead is not universal. A platform serving 8 engineers at USD 200 per hour fully loaded, where operation cost runs 15% of weekly hours, burns USD 2,400 per week in platform tax across the team. A platform serving 40 engineers at the same rate and the same percentage burns USD 12,000 per week. The absolute number changes the urgency of the decision even when the percentage stays constant.
Run the Honest Cost Ledger audit at the start of every planning quarter, not at the point of crisis. By the time a platform’s overhead becomes politically visible, the maintenance trap described earlier has already closed. The audit works when the team has enough runway to act on what it finds. It breaks when it is used to justify a decision already made rather than to inform one still open.
The specific next action is this: pull the last 30 days of incident tickets, tag each with operation, failure, or learning, sum the engineer-hours per column, and divide by total engineering capacity that month. That single calculation tells you which column is driving your IDP Tax and which lever to pull first.
