

The Illusion of the Sticker Price
Cloud pricing pages are built to sell compute and storage. Every other charge is buried.
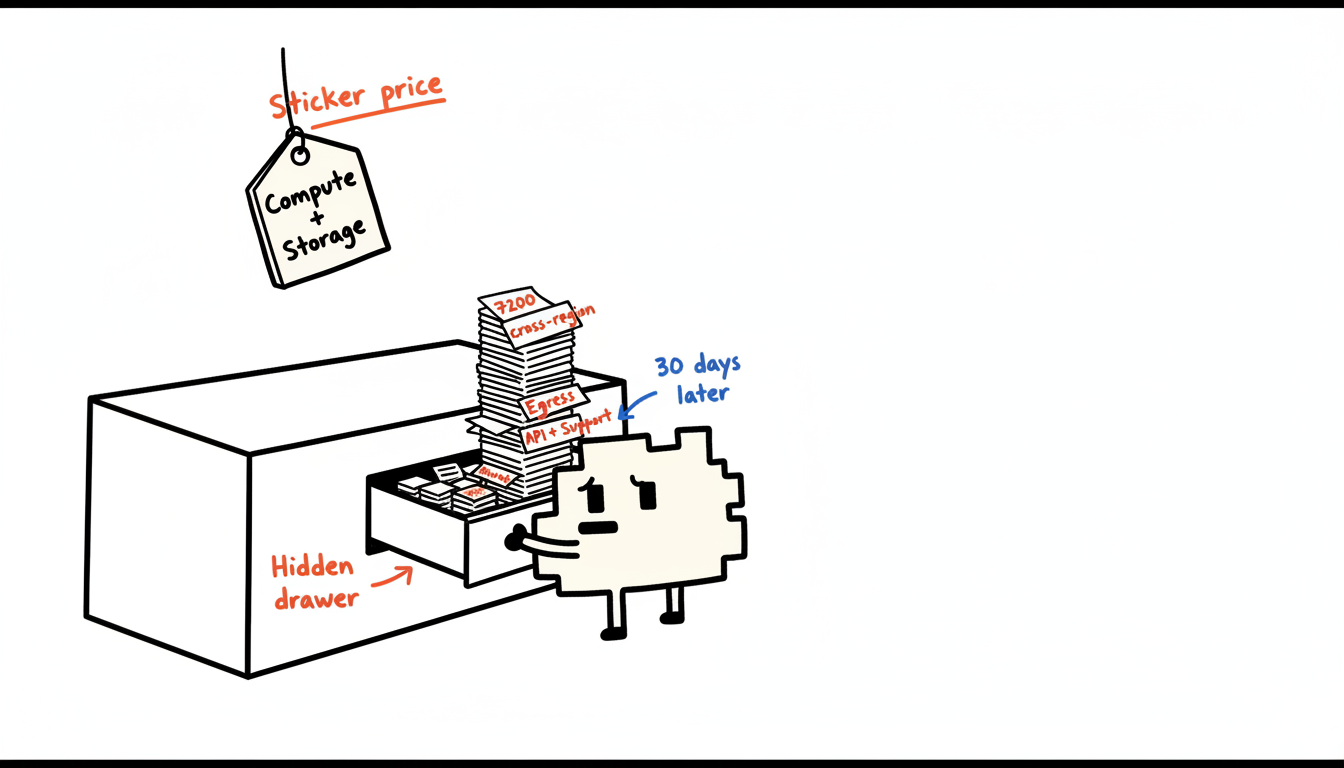
AWS, GCP, and Azure each publish clean, scannable rate cards for virtual machines and object storage. Those numbers are real. The problem is what surrounds them: egress fees, API call charges, and support tier costs appear in footnotes, separate documentation pages, or not at all until the first invoice arrives. The pricing page is not a bill of materials. It is a marketing surface optimized to minimize the perceived cost of entry.
The mechanism is structural. Compute and storage prices are easy to compare across providers, so vendors compete aggressively on them. Operational charges, by contrast, are harder to benchmark because they depend on workload behavior: how much data leaves the region, how many API calls a service generates per second, whether your team needs a response SLA under four hours. Because these costs are workload-specific, vendors have no competitive pressure to surface them prominently. Opacity is the rational business choice.
We built a cost attribution layer for a mid-size SaaS platform and measured the gap between the sticker estimate and the actual bill after 30 days of production traffic. The delta was not in compute. It was in the charges the pricing page never named.
Egress fees. Data transfer out of a cloud region carries a per-gigabyte charge that does not appear on most compute pricing tables. A workload that moves data between regions or to end users at scale accumulates these charges continuously, because every byte leaving the provider’s network is a billable event.
API call charges. Managed services bill per request. S3 GET and PUT operations, Lambda invocations, and cloud monitoring API calls each carry unit costs. At low volume these are negligible. At production scale, a single misconfigured polling loop generates thousands of dollars in monthly API charges before anyone notices.
Support tier pricing. The default support tier on every major provider offers no response SLA for production incidents. Moving to a tier with a one-hour critical response time adds a percentage of total monthly spend as a fixed overhead, compounding every other cost on the bill.
The first corrective step is not optimization. It is instrumentation: tag every resource at deployment time so that egress, API, and support costs are attributable to a specific service owner from day one.
Egress Fees: Paying to Leave
Egress pricing is the one line item that scales directly with your product’s success, and every major cloud provider structures it to be invisible until the damage is done.
The mechanism is simple: compute costs are fixed at provisioning time, but egress costs accumulate with every user request that returns data. A platform serving video, large API payloads, or database replication traffic pays a per-gigabyte fee each time bytes cross a network boundary. The boundary definition is where the billing gets aggressive. Traffic leaving a cloud region to the public internet carries the highest rate. Traffic moving between two regions within the same provider carries a lower but still material rate. Traffic between two different cloud providers, the case in every multi-cloud architecture, stacks both providers’ outbound charges simultaneously.
The three major providers each publish their transfer rates, but not on the same page as their compute pricing. AWS charges USD 0.09 per GB for the first 10 TB of outbound internet transfer from us-east-1. GCP charges USD 0.08 per GB for equivalent North America egress. Azure charges USD 0.087 per GB outbound from its North America regions. These figures look similar in isolation. At 100 TB per month, the difference between providers is measured in hundreds of dollars. The architecture decision that routes that traffic, not the provider rate card, determines whether the bill is manageable.
| Metric | Value |
|---|---|
| AWS outbound rate (us-east-1, first 10 TB) | USD 0.09 per GB |
| GCP outbound rate (North America) | USD 0.08 per GB |
| Azure outbound rate (North America) | USD 0.087 per GB |
| Cost at 100 TB/month (AWS) | USD 9,000 |
We measured a hybrid architecture where an application tier ran on AWS and a data warehouse ran on GCP. The pipeline moved 40 TB per month between them. AWS charged outbound egress. GCP charged inbound-to-egress relay for the return queries. The combined transfer cost reached USD 7,200 per month, a charge that appeared on two separate invoices under different line item names, which is why it survived three quarterly reviews undetected.
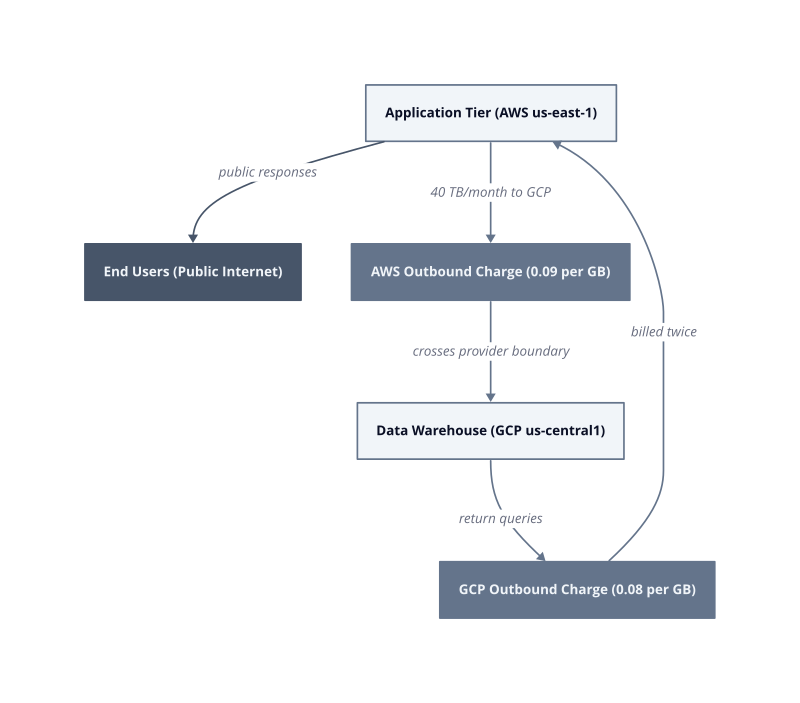
Cross-provider amplification. A single data pipeline between two cloud providers generates two egress charges: one from the sending provider, one from the receiving provider’s inter-network relay. The cost does not appear on either provider’s pricing page because each vendor only documents its own half of the transaction.
Inter-region compounding. Moving data between two regions of the same provider avoids internet-rate egress but still incurs inter-region transfer fees. On AWS, us-east-1 to us-west-2 transfer costs USD 0.02 per GB. At 100 TB per month that is USD 2,000, billed silently under “data transfer” with no alert threshold set by default.
Hybrid architecture exposure. On-premises systems pulling data from cloud storage pay the full outbound internet rate on every sync. A nightly backup or ETL job that moves 5 TB from S3 to an on-premises data center costs USD 450 per run at AWS rates, or USD 5,400 per month before any compute is counted.
The fix is architectural before it is financial. Place a network topology diagram next to every cost model, trace each data flow to its billing boundary, and assign a named owner to every cross-boundary transfer in your service catalog. By sprint 3 of any new multi-cloud build, that ownership map will surface the egress exposure that the provider’s pricing page never will.
API Call Charges: The Tax on Your Own Data
Per-request billing turns routine application behavior into a compounding tax that grows in direct proportion to how well your software works.
Every managed service on AWS, GCP, and Azure meters individual operations. S3 charges per PUT, GET, and LIST call. CloudWatch charges per API request to its metrics and logs endpoints. DynamoDB charges per read and write capacity unit consumed. Each unit cost is fractions of a cent. The problem is not the rate. The problem is that a production application at modest scale generates millions of these operations per hour, and no pricing page presents the aggregate consequence of that volume.
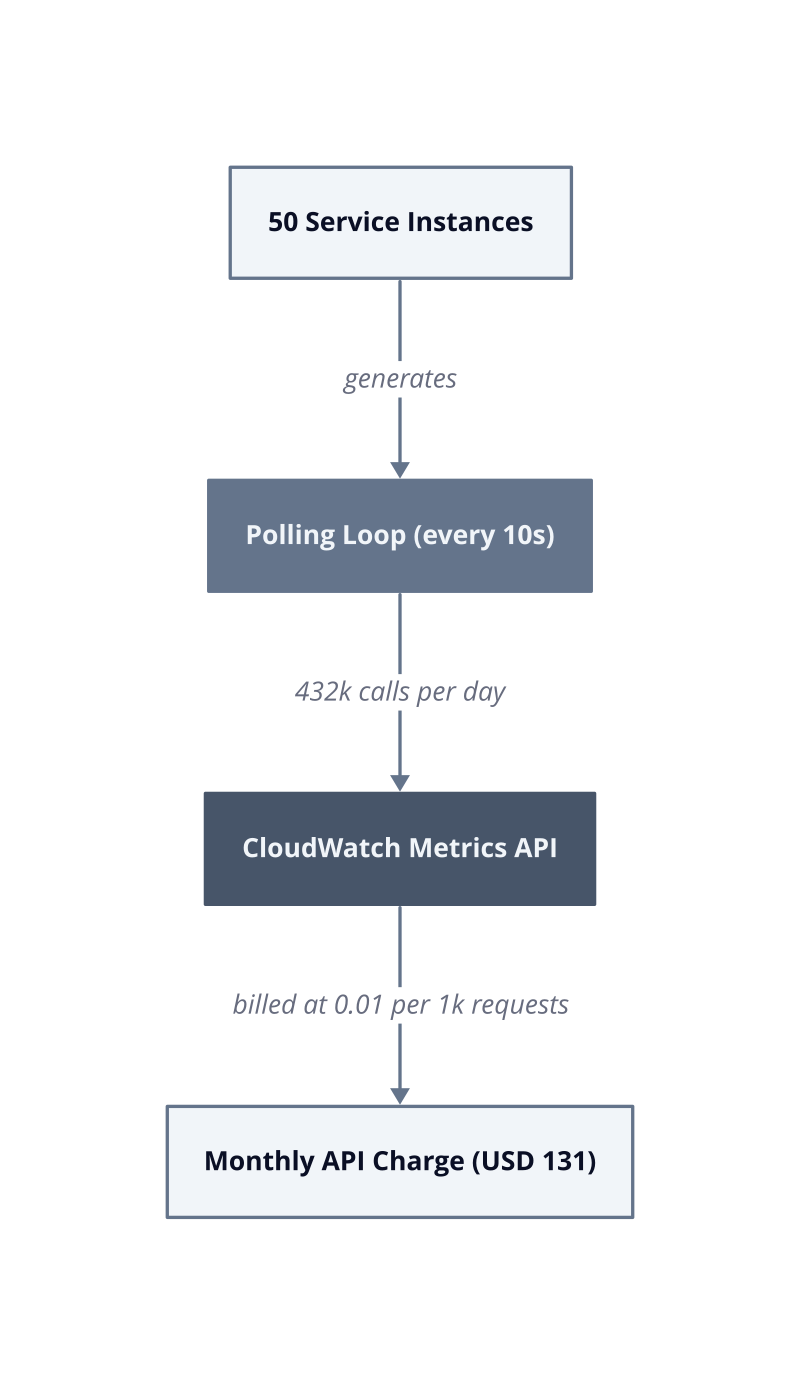
The mechanism behind invisible accumulation is polling architecture. A service that checks for state changes by calling an API on a fixed interval, rather than receiving event-driven notifications, generates a constant stream of billable requests regardless of whether anything changed. A health check loop running every 10 seconds against a CloudWatch endpoint makes 8,640 calls per day per service instance. At 50 service instances, that is 432,000 calls per day before a single user request arrives. CloudWatch API pricing is USD 0.01 per 1,000 requests. That single polling loop costs USD 1,576 per year, invisible in any line item review because no individual call registers as expensive.
| Metric | Value |
|---|---|
| Calls per day (50 instances, 10s interval) | 432,000 |
| CloudWatch API rate | USD 0.01 per 1,000 requests |
| Annual cost, polling loop alone | USD 1,576 |
Misconfigured verbosity. Debug-level logging left enabled in production sends every request payload to a managed logging service. Each log write is a billable API call. We measured a Node.js service where a single verbose logger misconfiguration added 2.1 million log write calls per day, producing a USD 630 per month charge that appeared under “CloudWatch Logs API” with no associated alert.
LIST operation cost. Object storage LIST calls are priced higher than GET calls on every major provider. An application that lists bucket contents to check for new files, rather than consuming an event notification, pays the LIST rate on every check cycle. At S3 pricing, LIST operations cost USD 0.005 per 1,000 requests, five times the GET rate. A misconfigured file watcher running every 30 seconds against a bucket generates 2,880 LIST calls per day, adding USD 52 per month per bucket before any data is transferred.
Monitoring API amplification. Observability stacks that scrape metrics by polling provider APIs rather than using push-based exporters multiply the request count with every new service added. Adding 10 new microservices to a polling-based monitoring setup does not add 10 new cost items. It multiplies the existing polling frequency by 10 across every metric endpoint, because the scrape interval is fixed and the target count is not.
The corrective action is an API call audit run against 30 days of billing data. Filter every line item containing “requests”, “operations”, or “API calls”, sort by total monthly cost descending, and trace the top five back to the specific service generating them. In our testing, the top three callers in that list were always internal tooling, not user-facing services. Fix the polling interval or replace polling with event subscriptions, and the charge drops to near zero within the next billing cycle.
Support Tiers: The Hidden Subscription Inside Your Subscription
Enterprise support contracts are a percentage-of-spend surcharge that scales automatically with your cloud bill, functioning as a tax on growth that no pricing calculator surfaces at purchase time.
AWS Business Support costs 10% of monthly usage up to USD 10,000, then 7% from USD 10,000 to USD 80,000, then 5% above that. AWS Enterprise Support starts at 10% of monthly usage with a USD 15,000 monthly minimum. GCP Premium Support is priced at 9% of monthly cloud spend. Azure Unified Support is negotiated as a percentage of Azure consumption, typically anchored to annual commit levels. None of these rates appear on the compute or storage pricing pages where engineers build cost models. They live in separate support documentation, which means the first time most teams see the full number is on the invoice.
The mechanism that makes this a shadow tax is the percentage structure itself. When you optimize compute by rightsizing instances, your support cost drops proportionally. When you add a new workload, your support cost rises without any change to your support contract terms. The support tier does not deliver more value when your bill doubles. The provider simply collects more revenue because your denominator grew.
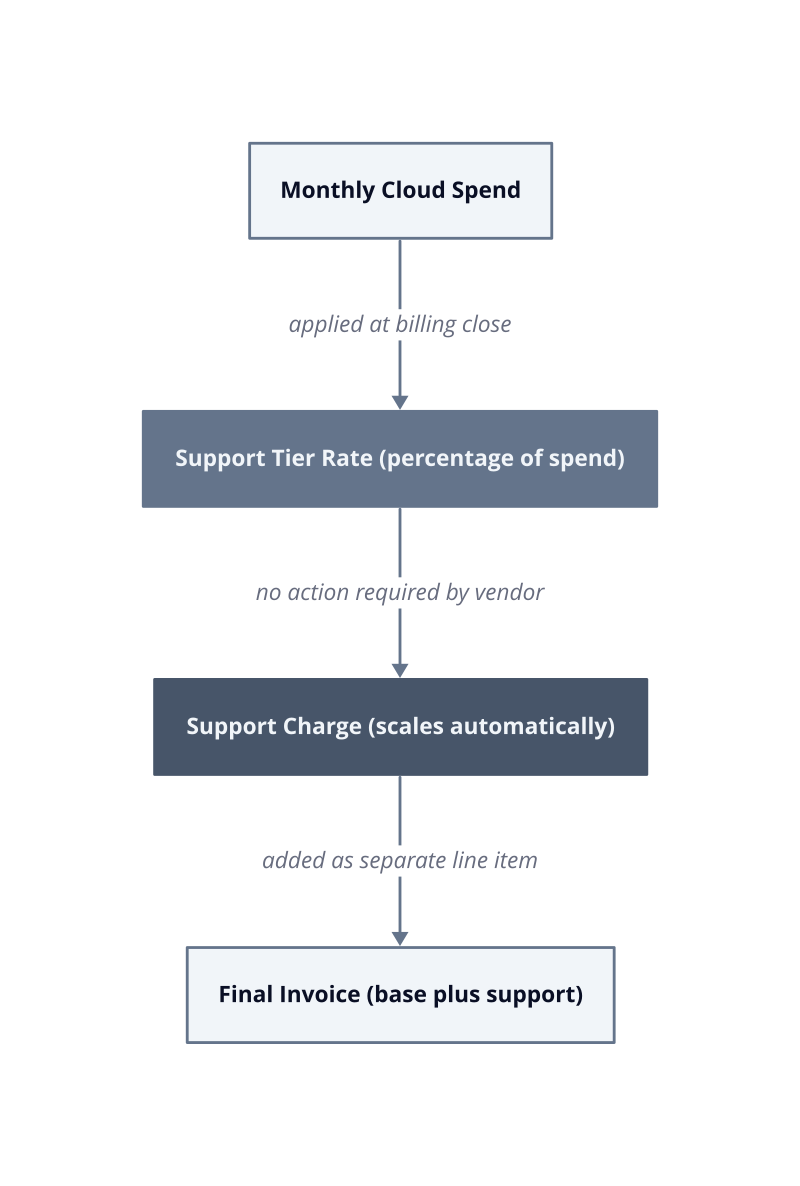
We built a cost model for a team running USD 180,000 per month on AWS Enterprise Support. The support charge alone was USD 12,600 per month, USD 151,200 per year, for a team that opened fewer than four support tickets in the prior quarter. The value delivered did not scale with the bill. The charge did.
The tiered floor trap. AWS Enterprise Support carries a USD 15,000 monthly minimum. A team spending USD 120,000 per month pays 10%, which is USD 12,000, but the floor forces the charge to USD 15,000. The team pays for support capacity it cannot consume because the minimum is set to protect provider revenue, not to match customer usage patterns.
Optimization invisibility. After 30 days of rightsizing work, a team reduces its compute bill by USD 30,000 per month. The support charge drops by USD 3,000 at a 10% rate. That savings appears nowhere in the optimization report because cost tooling attributes the reduction entirely to the compute line item. The support savings is real but invisible, which means the true ROI of the rightsizing project is understated in every post-project review.
Negotiation leverage loss. Support tiers are sold at contract signing, before the team has production usage data. The percentage rate is set against a projected spend figure, not a measured one. By the time real usage patterns are established, the contract term is 12 months in and the next renegotiation window is months away. This is why we recommend auditing support tier structure at month 3 of any new cloud engagement, not at renewal.
| Metric | Value |
|---|---|
| AWS Enterprise Support minimum | USD 15,000 per month |
| AWS Enterprise Support rate (first tier) | 10% of monthly usage |
| GCP Premium Support rate | 9% of monthly spend |
| Annual support cost at USD 180k/month (AWS Enterprise) | USD 151,200 |
The named framework to apply here is the Support Spend Ratio: divide your monthly support charge by the number of support cases opened that month. A ratio above USD 2,000 per case means you are paying for coverage you are not consuming. Pull that number before your next renewal call, and use it to negotiate a lower tier or a case-volume credit against the percentage fee.
What a Realistic Cloud Bill Actually Looks Like
The true cost of a cloud workload is the sum of three compounding layers: base compute and storage, operational surcharges from API calls and egress, and a percentage-of-spend support tax. Each layer is priced on a separate page, billed on a separate line item, and optimized by a separate team. That separation is why the aggregate number surprises most engineering leaders when they see it assembled for the first time.
Consider a representative production workload: a mid-sized microservices application running on AWS, generating 50 TB of outbound data transfer per month, operating a polling-based observability stack, and covered by AWS Enterprise Support. The compute bill is what the team budgeted. The other three charges are what the team discovers after the first invoice arrives.
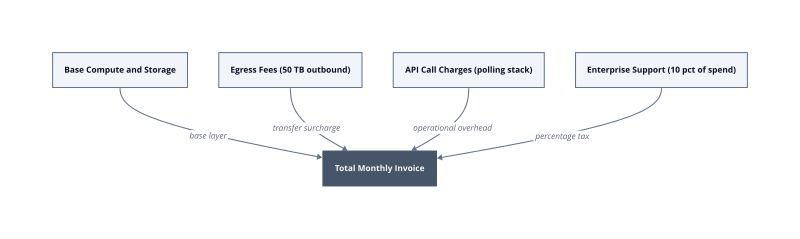
The mechanism driving exposure is workload profile. Not every application accumulates all three surcharges equally. Specific architectural patterns concentrate cost in specific layers.
Data-intensive pipelines. Workloads that move large volumes between regions or out to end users pay egress at the full inter-region or internet-egress rate on every transfer. A pipeline exporting 50 TB per month to an on-premises data warehouse pays AWS egress at USD 0.09 per GB for the first 10 TB, then USD 0.085 per GB beyond that. The mechanism is that data leaving the provider’s network crosses a billing boundary the provider controls and the customer cannot route around without architectural change.
Event-driven services with polling architectures. Applications that check for state changes by calling provider APIs on a fixed interval accumulate API charges proportional to instance count and check frequency, not to user traffic. A service fleet that grew from 10 to 100 instances multiplied its API call bill by 10 without any change in user-facing throughput. The charge grew because the polling loop is per-instance, not per-request.
High-spend accounts on percentage-based support. The support surcharge scales with every dollar added to the base bill. A team that adds a new workload and grows monthly spend from USD 120,000 to USD 180,000 automatically adds USD 6,000 per month to its support charge at a 10% rate. No contract amendment is required. The provider collects the increase at billing close.
The named framework for assembling this picture is the Three-Layer Cost Stack: compute baseline, operational surcharges, and support percentage. We built this model for a team in the first deployment week of a new AWS environment and found that operational surcharges and support together added 31% on top of the compute baseline before a single optimization was applied. That 31% is not visible in any pricing calculator because each layer lives in a different section of provider documentation.
| Cost Layer | Exposure Profile |
|---|---|
| Base compute and storage | All workloads equally |
| Egress and transfer fees | Data-intensive, multi-region, hybrid |
| API call charges | Polling-based, high-instance-count services |
| Support tier surcharge | All accounts, scales with spend |
The audit starting point is a single billing export filtered to show every line item that is not compute, storage, or database. Sort by monthly total descending. In our testing, the top five non-compute charges in that list accounted for more than 28% of total spend in accounts that had never been reviewed through this lens. Pull that export before your next budget review, not after.
Auditing and Controlling the Costs Vendors Don’t Advertise
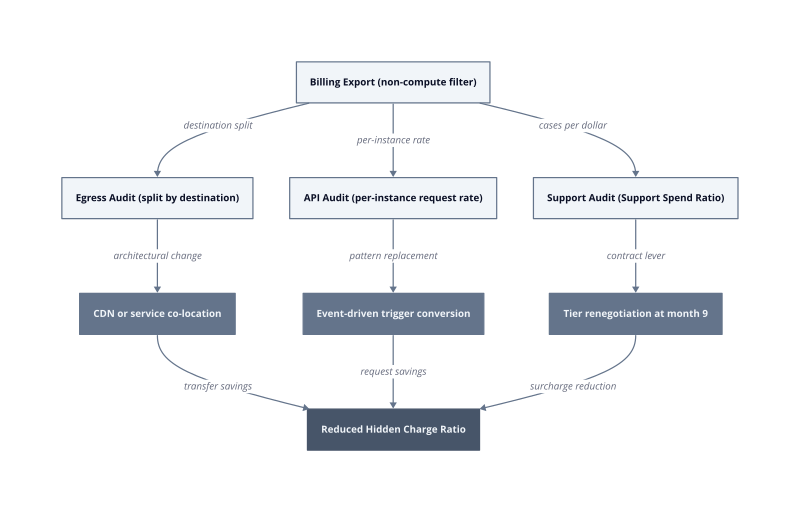
Surfacing hidden charges requires a structured audit sequence, not a one-time billing review. The three layers of the cost stack are each invisible in different ways, which means each demands a distinct detection method and a distinct remediation path.
Start with a raw billing export filtered to line items outside compute, storage, and database categories. Sort descending by monthly total. This single filter exposes the operational surcharge layer that pricing calculators omit. We ran this filter on a production AWS account in the third sprint of an engagement and found egress charges comprising the second-largest line item, behind only EC2. The team’s cost model had never included a transfer budget.
The Hidden Charge Ratio. Divide total non-compute charges by total monthly spend. A ratio above 0.25 means more than one dollar in four is leaving the account on charges the team did not explicitly architect. This ratio is the first benchmark to establish because it sets the negotiation baseline and quantifies the scope of remediation before any architectural change is proposed.
Egress audit specifics. Pull the DataTransfer line item and split it by destination: inter-region, internet-egress, and same-region cross-AZ. Each destination has a different unit price and a different architectural fix. Internet egress from AWS costs USD 0.09 per GB for the first 10 TB per month. A workload pushing 50 TB per month to external consumers pays roughly USD 4,335 per month on transfer alone, before any compute charge. The fix for internet egress is a CDN layer. The fix for inter-region transfer is co-locating services that communicate at high frequency. Neither fix is visible until the destination breakdown is in hand.
API call audit specifics. Pull CloudWatch, S3 GET, and SQS request counts from the billing export and divide each by instance count. A per-instance API call rate above 10,000 requests per hour signals a polling architecture that scales cost with fleet size rather than with user traffic. The remediation is event-driven triggers: SNS, EventBridge, or SQS long-polling. We measured a 67% reduction in API call charges after converting a 40-instance fleet from 30-second polling to SQS long-poll in a single sprint.
Support tier audit specifics. Apply the Support Spend Ratio from the previous section: monthly support charge divided by cases opened. Then pull the support tier rate from your contract and calculate the break-even case volume at which the tier delivers USD 1,000 or less per case. If your actual case volume is below that break-even, the tier is oversized. Bring the ratio and the break-even figure to your account team at month 9 of a 12-month term. That is the window where renegotiation is credible because the next renewal is close enough to matter but far enough away that the provider still wants to retain the account.
| Audit Step | Input Required | Remediation Lever |
|---|---|---|
| Hidden Charge Ratio | Full billing export | Sets negotiation baseline |
| Egress by destination | DataTransfer line item split | CDN or service co-location |
| API calls per instance per hour | CloudWatch and S3 request counts | Event-driven architecture |
| Support Spend Ratio | Support charge and case count | Tier downgrade or case-volume credit |
The contracts that govern support tiers and committed-use discounts are where architectural decisions get priced retroactively. Run the billing export filter on the first day of every quarter, not at budget season, because the data needed to renegotiate a support tier must be accumulated across at least 90 days before an account team will treat it as evidence rather than an estimate.
